Average cyclist is 43, male, 12 stone and 5'10": how do you measure up?
The latest race content, interviews, features, reviews and expert buying guides, direct to your inbox!
You are now subscribed
Your newsletter sign-up was successful
As the cycling boom continues, Cycling Weekly sets out to uncover who our readers truly are, why they ride, how far and how often.
The development of sport science, once the preserve of pro riders, is now within reach of us all. How has this affected the way we ride?
Have the advances in bike fit, strength and conditioning training and the intricacies and specificities of coaching helped ‘normal’ riders?
Our understanding of nutrition has also advanced, but is this filtering down to everyone? All this is covered in our huge online survey that drew over 1,400 responses. How do you measure up?
Q1 Male or Female
Male 90%
Female 10 %
Though cycling is still a male-dominated sport, there has been a steady increase in female cyclists over the past seven years. In 2007, just two per cent of respondents were women — a figure that has jumped by eight per cent. Role models tremendously help, and with the likes of Laura Trott, Dani King and Lizzie Armitstead going from strength to strength and proving that British women can compete at the highest level, this figure is only going to increase.
The latest race content, interviews, features, reviews and expert buying guides, direct to your inbox!
Q2 How old are you?
Average age: 43 years and one month
10-15 years 0.6%
16-20 years 2.7%
21-25 years 4.6%
26-30 years 7.2%
31-35 years 8.0%
36-40 years 14.4%
41-45 years 18.5%
46-50 years 19.0%
51-55 years 13.0%
56-60 years 6.8%
61-65 years 2.7%
66-70 years 1.5%
Over 70 years 1.0%
The variety of ages is quite remarkable, with some as young as 10 taking to two wheels, and a few still riding well into their seventies. It just goes to show how diverse cycling is — no matter your age, you can enjoy being out on the bike.
Q3 How long have you been cycling?
Average length: 12 years and 9 months
0-1 years 10.3%
2-3 18.9%
3-4 10.3%
4-5 7.2%
5-6 5.4%
6-7 4.0%
8-9 4.2%
10-15 7.3%
16-20 4.6%
20-30 8.5%
Over 30 years 19.1%
Over 19 per cent of you have been riding for more than 30 years, which goes to show how cycling is more than just a bit of fun — it’s a way of life. But what raises a few eyebrows, albeit in a pleasing manner, is the number of cyclists who have been riding for no more than a couple of years. Nearly 30 per cent have only been riding for three years, which perhaps highlights the impact the success of the London Olympics and Tour de France has had. Having more people join our fantastic sport can only be a good thing, particularly if it rejuvenates the club and racing scene.
Q4 How tall are you?
Average height: 5'10"
Over 6’8” 0.1%
6’8” 0.1%
6’7” 0.1%
6’6” 0.2%
6’5” 0.6%
6’4” 1.8%
6’3” 3.2%
6’2” 7%
6’1” 7.9%
6’0” 13.1%
5’11” 13.4%
5’10” 15%
5’9” 10.6%
5’8” 9.4%
5’7” 7.5%
5’6” 4.4%
5’5” 1.5%
5’4” 1.8%
Under 5’4” 2.6%
It seems you have grown by one inch in seven years, which takes you just over the British national average.
Q5 Do you hold a British Cycling racing licence?
No 84%
Yes 16%
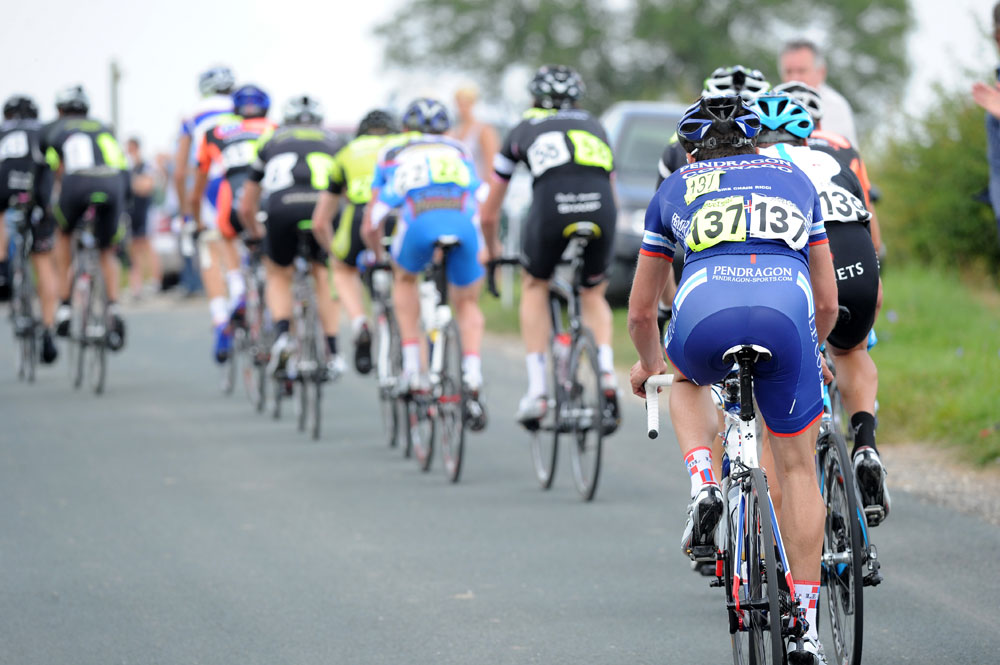
In the space of just seven years, the number of respondents with a BC racing licence has dropped by a staggering 47.2 per cent. Is it because of the boom in sportives? Is it because of the huge influx of new cyclists who are more interested in leisure riding than racing? It would be good to see more riders pinning a number on the back of their jerseys at the weekend — not just on their handlebars.
Q6 Do you own a power meter?
Yes 9%
No 91%
Not really a surprising figure, considering the number of new cyclists and the fall in the number of race licence holders. However, there’s no denying that power meters are a great tool to improve performance. Training with data gives riders a clear indication of their progression. In the past, power meters cost a small fortune and were seen as a luxury, but cheaper, more affordable ones are beginning to appear. It’s only a matter of time before that 9.3 per cent rises.
Q7 How much do you weigh?
Average weight: 12st 3lb
Under 10 stone 8.7%
10-11 29.9%
12-13 39.3%
14-15 14.8%
16-17 4.4%
18-19 1.1%
Over 19 stone 1.2%
Another interesting set of results — with a surprising number of people weighing over 15st. Then again, perhaps it’s not so surprising. While you might presume that cyclists weigh very little — power to weight being so important — with so many people currently giving cycling a go, many of whom have jumped across from other sports such as rugby, rowing and football, it stands to reason that many will be, um, well built. Is the shape of cycling changing? It seems so.
Q8 Do you have a coach?
No 95%
Yes 5%
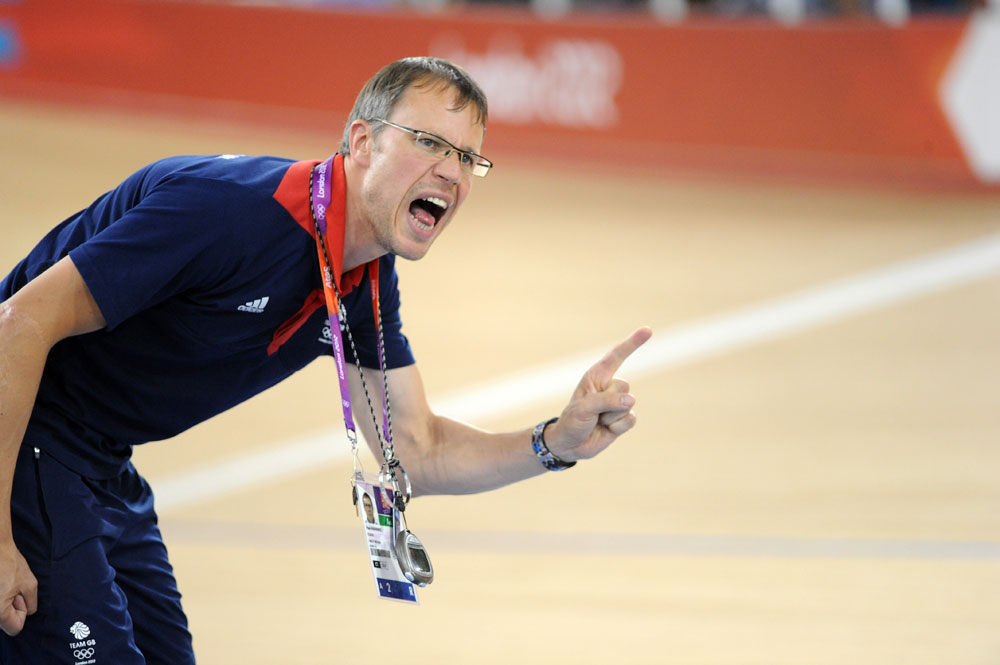
These figures haven’t changed much since 2007 (six per cent yes, 94 per cent no). Remember, you don’t have to be a pro to have a coach. Many amateurs see coaching as an elitist method of training. Wrong! A coach can have numerous benefits; he or she can provide motivation, act as a confidant, a friend, a mentor or even someone to offload stress on to. Coaches can help in a number of ways, not just to improve your performance, but to address everything from your technique to weight loss. If you are thinking of getting a coach, British Cycling lists all of its coaches, by region and discipline, on its website.
Q9 Do you follow a training plan?
No 74%
Yes 26%
Over a quarter of you follow a training programme, which shows that at least some of you are taking notice of us! Training plans aren’t geeky; they simply help provide structured, progressive training, eliminating the chances of under or overtraining. Whether you’re a racer, sportive rider or cycling commuter, having some sort of plan helps create a routine, which will help improve fitness and also help you reach the goals you have set yourself.
Q10 Have you ever ridden a sportive?
Yes 69%
No 31%
In 2007 we wrote, “More than half of you have taken part in the increasing number of challenge rides and cyclo-sportives on the calendar. This figure is bound to increase further in the coming years as the sportive boom takes hold.” But little did we know just how much of a boom was going to happen. Each weekend, up and down the country, thousands of you are taking part in sportives. Events such as the Dragon Ride, which has over 4,500 entrants and the Dartmoor Classic, which has just over 3,000 entrants, sell out within days. Sportives are great fun and provide a challenge for cyclists of all abilities, taking you through some of the most picturesque roads in the UK.
Q11 Do you ride a cyclo-cross bike?
No 88%
Yes 12%
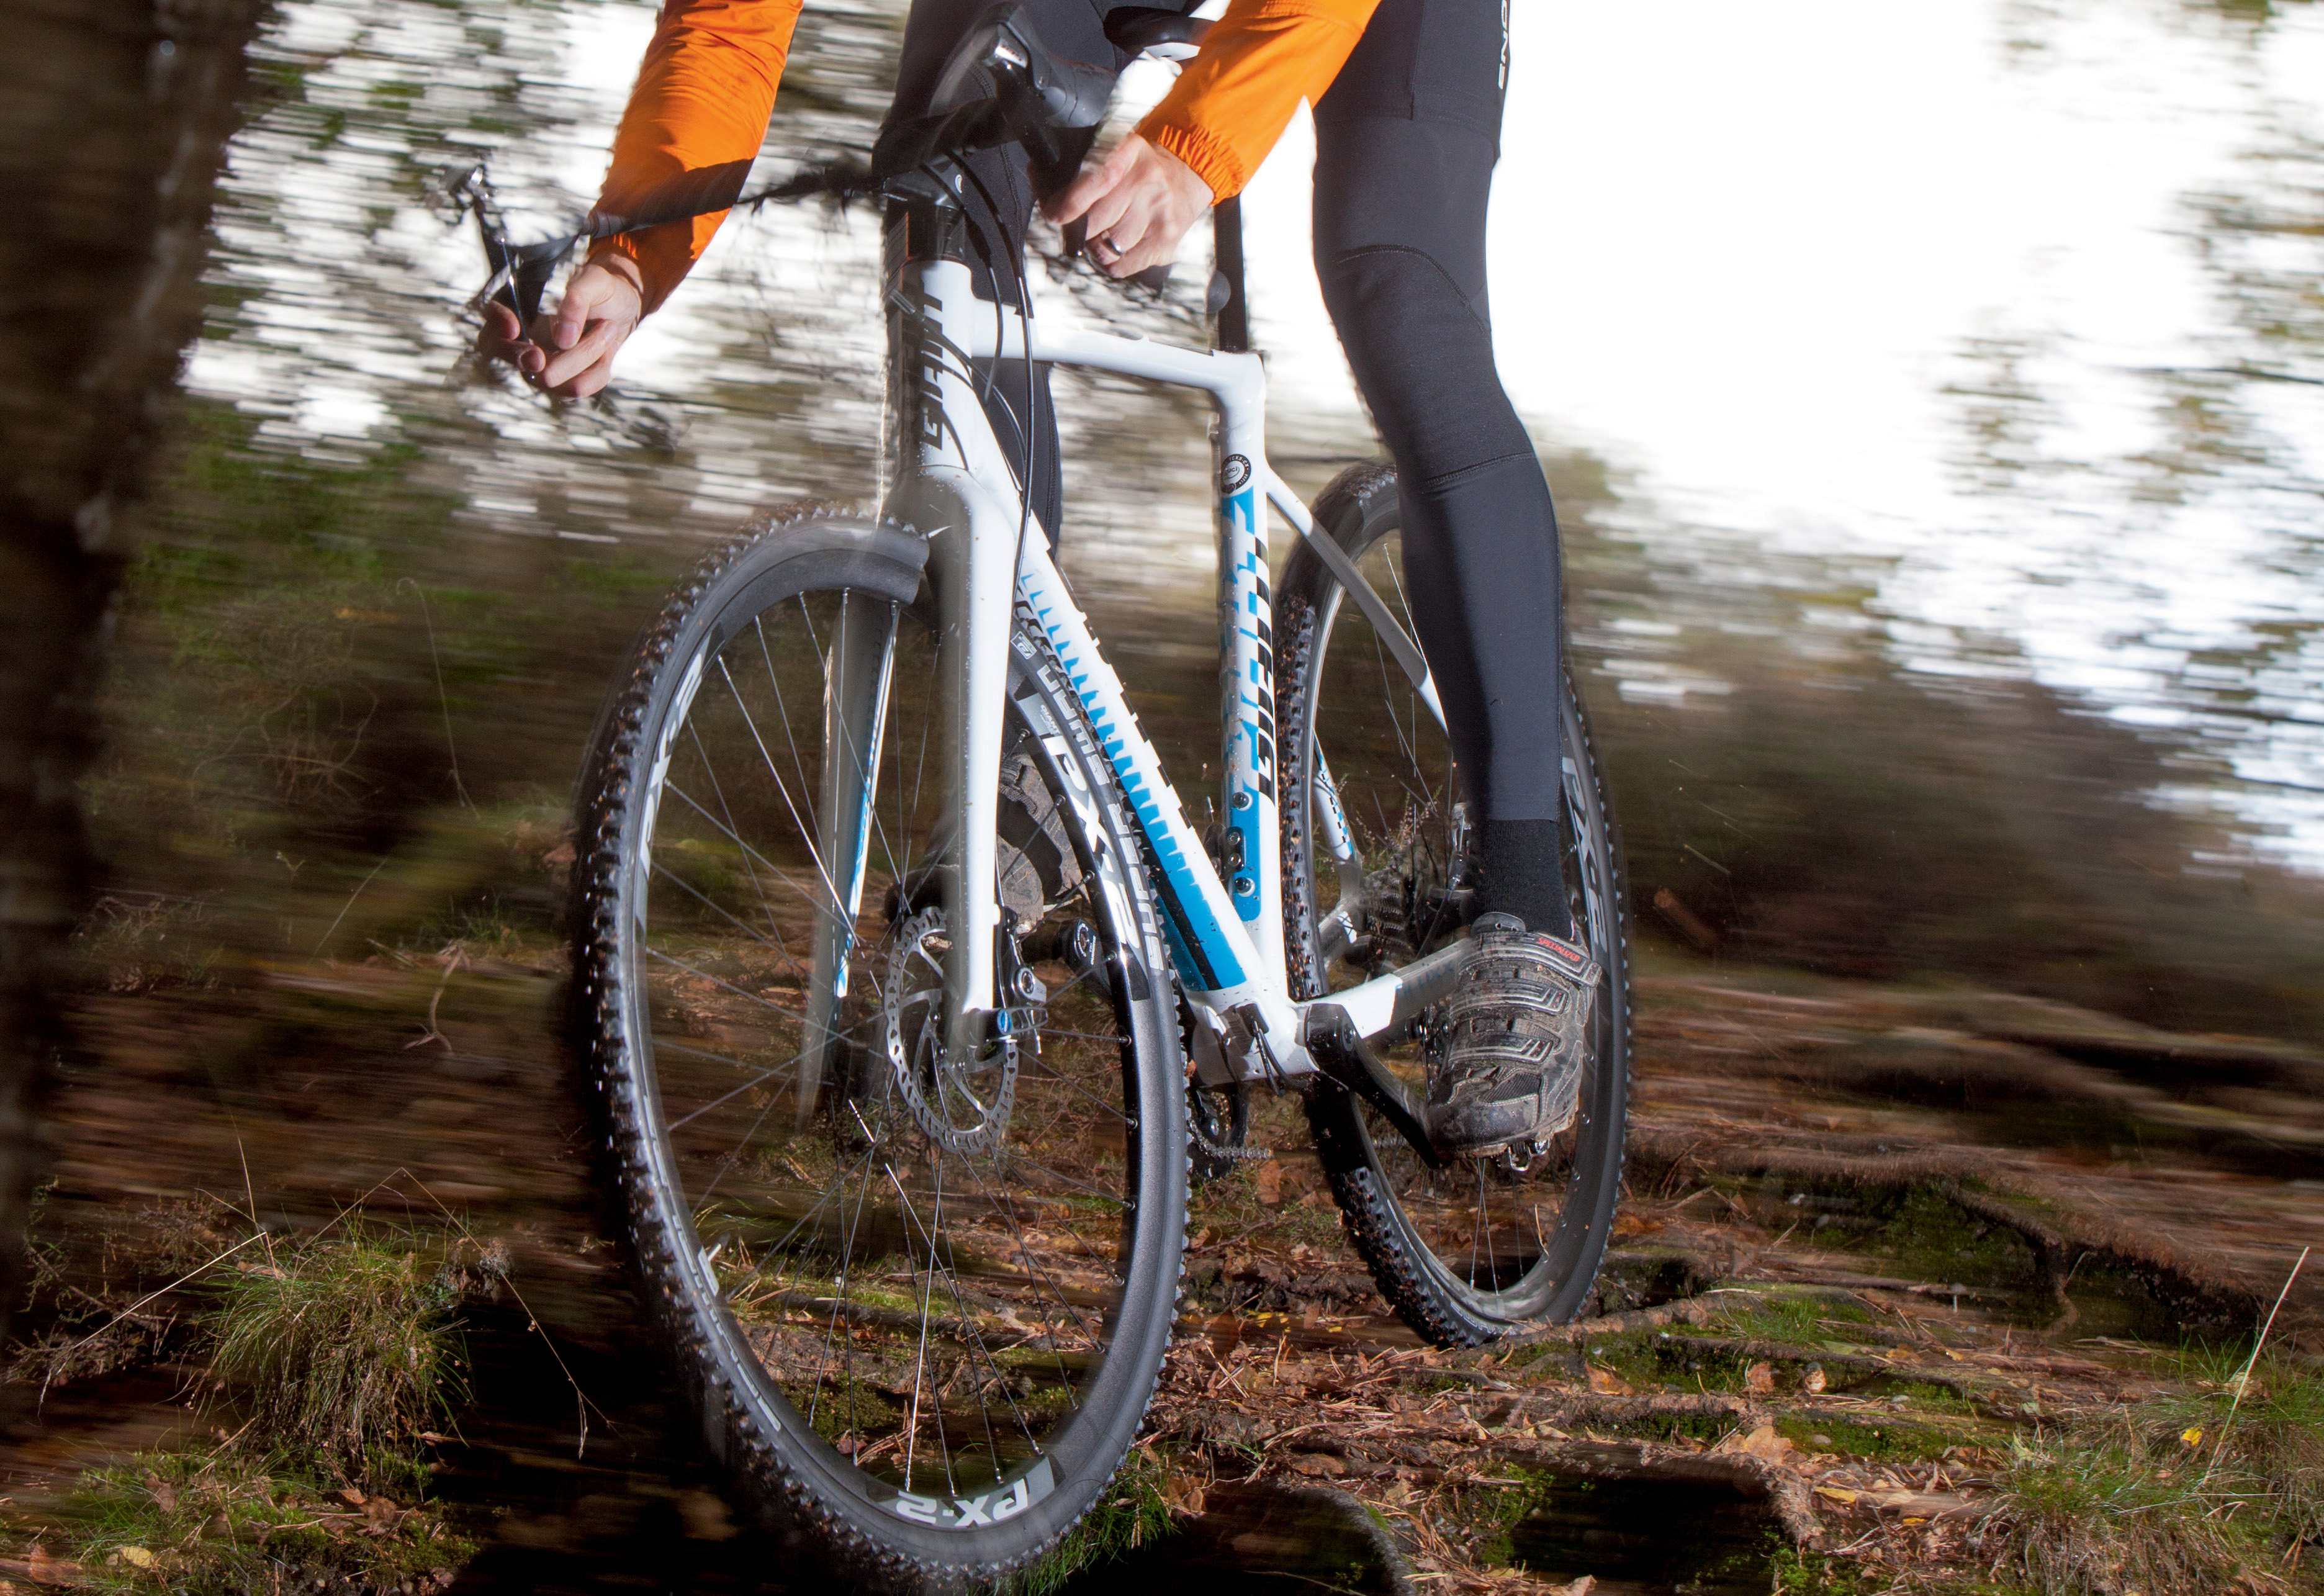
Cyclo-cross is a great form of off-season training, but despite our best efforts to champion the excitement and skills benefits — not to mention that it’s great fun — according to our stats, bums on cyclo-cross bikes have actually declined.
Q12 How many events do you do in a year?
1-5 71.6%
6-10 15.2%
11-15 5.0%
16-20 2.7%
21-25 1.7%
26-30 1.4%
31-35 0.6%
36-40 0.6%
41-50 0.4%
51-60 0.8%
A significant proportion of you enter between one and five events a year. Come on, guys, pull your finger out! What’s pleasing is that many ride over 15 events a year, which is around one a month, with some entering over 50 events a year. That’s almost one a week! Great stuff.
Q13 Are you happy with your weight?
Too light 1.8%
Too heavy 58.1%
Just right 40.1%
Q14 Are you training to lose weight?
No 39%
Yes 61%
With nearly 60 per cent thinking they are too heavy, it’s hardly surprising that many of you are trying to lose weight. Before dieting, it’s important to set goals and clear targets. How much weight do you want to lose, and why? It’s really important to review your diet. Which foods should you cut out? Which bad foods could you do without? Remember, if you are exercising, you still need enough calories to fuel your rides.
Q15 How much weight do you want to lose?
None 34.4%
1-2lbs 4.5%
3-5lbs 13.8%
6-10lbs 20.5%
11-15lbs 11.6%
16-20lbs 6.9%
21-30lbs 4.8%
31-40lbs 1.3%
Over 40lbs 2.2%
Q16 Do you use energy drinks?
Yes 59%
No 41%
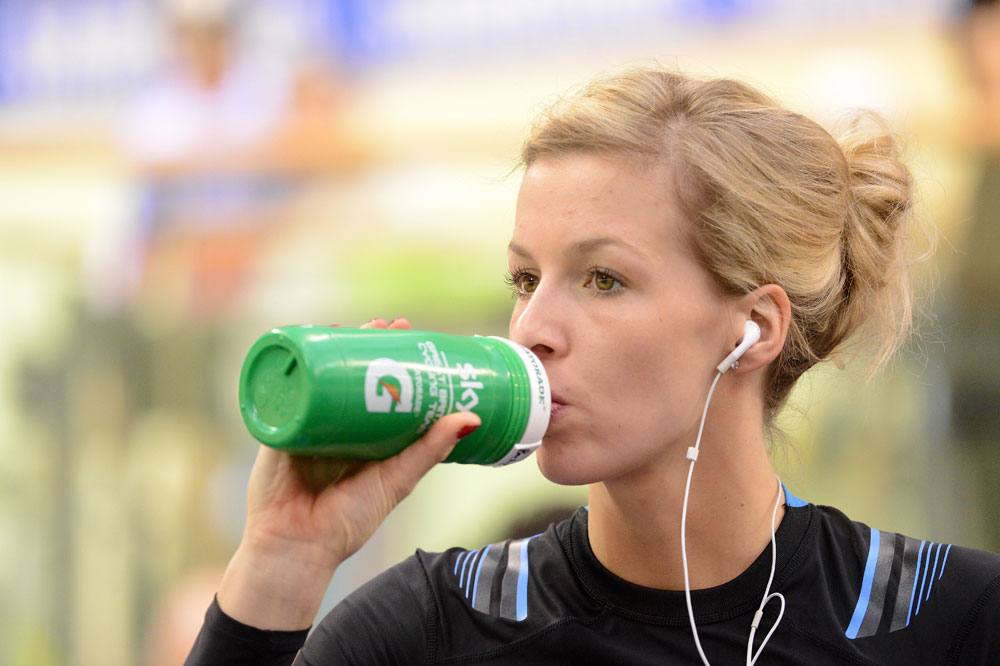
Sports nutrition has grown exponentially over the last few years and is now a multi-million-pound industry. So you would think that more CW readers are using energy drinks in 2014, but this isn’t the case. In fact, numbers have dropped by over 18 per cent. It is quite surprising. Having said that, if you are only riding one or two events a year, don’t race, and want to lose weight, avoiding extra sugars may be wise.
Another factor may be education and spread of knowledge. We now live in a world where information, research and studies are readily available. People have a choice of reading resources from which to seek advice — and ultimately make up
their minds.
Q17 Do you buy recovery drinks?
No 51%
Yes 49%
Many of you buy recovery drinks; one would presume you understand the importance of recovery and the effect it can have on performance. However, 51 per cent simply don’t buy these products. Are these cyclists failing to take their recovery seriously? Maybe not — it could be down to the fact that many prefer real foods as opposed to protein shakes. After all, real food does just as good a job as protein drinks — provided you know which ingredients to include. And let’s face it, real food is far tastier too. A recovery meal full of protein (muscle repair), carbohydrates (energy replenishment) and water (rehydration), is a suitable, if not a better, substitute for recovery drinks.
Q18 Do you use energy gels?
Yes 65%
No 35%
More CW readers use gels than use energy drinks.
Q19 Which area of your cycling most needs improvement?
Climbing 43.6%
Flat speed 18.4%
Skills and technique 13.5%
Endurance 16.5%
Sprint 8.0%
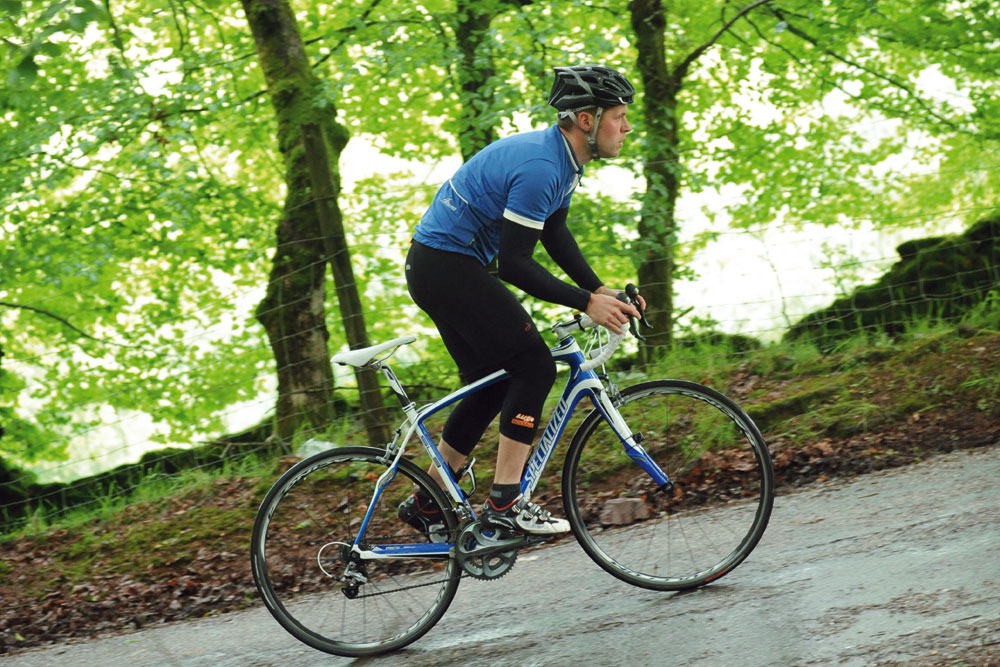
Now this really isn’t a surprising answer. Climbing is an area that we all struggle with, and sometimes it seems that no matter how hard we train and try to improve, it never gets any easier. But trust us on this one: it will. OK, it’s going to take hard work, effort and dedication. If you’re not seeing the improvements you would like, then you aren’t pushing hard enough. Climbing speed and body weight go hand in hand; if you’re unhappy with your body weight, you’re probably also unhappy with your climbing.
Q20 Who do you ride with?
A club 34.1%
My friends 54.2%
On my own 72.6%
While cycling is predominantly an individual sport, many of us enjoy riding with friends. Social rides are great fun and provide great motivation. If you’re struggling to find cycling companions, fear not; seek out your local cycling clubs and groups. Meet fellow cyclists at sportives, and check blogs and websites that advertise rides for people on the lookout for cycling buddies.
Q21 If you train indoors, what equipment do you mainly use?
Don't train indoors 35.2%
Turbo 45.5%
Rollers 7.0%
Wattbike 3.9%
Other 8.4%
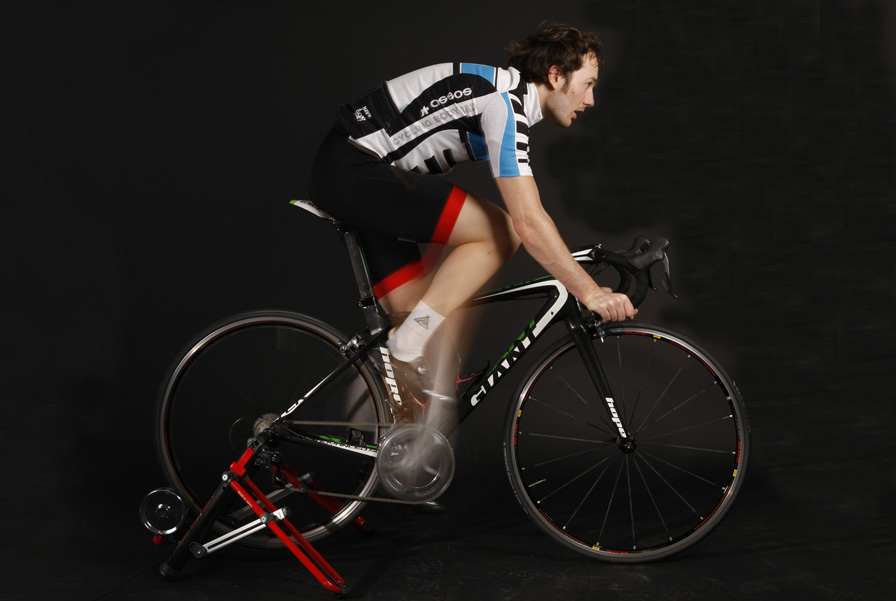
Despite the hatred many of you hold for turbo trainers, for many others, it’s something of a guilty pleasure. OK, if not a pleasure, then a necessary evil. Riding on rollers is an acquired skill and does take some getting used to. Other pieces of kit such as the Wattbike, although very effective, are still rather expensive, which may be deterring many. We’re now starting to see the uptake of training DVDs such as ‘Sufferfest’, which help structure turbo-training sessions and inject some ‘fun’ — we use the term advisedly — into proceedings, and very recently online training platforms such as Zwift, which, through the power of technology, enables you to compete against other riders from across the globe in funky games and challenges.
Q22 What one thing prevents you from improving your fitness?
Lack of time due to work commitments 37.9%
Lack of time due to family commitments 28.3%
Finances 3.9%
Motivation 9.2%
Other hobbies/interests 10.3%
Not knowing what to do 10.3%
All work and no play makes for a bunch of very grumpy cyclists. Work commitments are the biggest barrier preventing amateur cyclists from getting out on their bikes as much as they would like. Unfortunately, there aren’t many ways around it. This is why training plans are very effective for maximising time and efficiency. If you’re struggling to fit in cycling around work, then why not commute to work by bike? Cycling to work is a fantastic way to get some miles under your belt each day and keep on top of your fitness without having to worry about work commitments.
Q23 How many hours do you ride a week indoors?
0 44.2%
1-2 37.1%
3-4 12.5%
5-6 3.7%
7-8 1.3%
9-10 1.3%
Q24 How many hours a week do you ride outdoors?
0 0.6%
1-2 4.8%
2-3 8.7%
3-4 12.3%
4-5 11.9%
5-6 16.0%
6-7 14.6%
8-9 11.8%
10-11 12.4%
12-13 3.7%
14-15 1.6%
15-20 1.8%
What’s pleasing is that the majority of you get out on the bike for at least an hour each week, while a significant proportion ride between five and six hours a week. That’s great stuff and will really help maintain and even improve fitness. A lot of you ride for 10 hours and over, with a small percentage cycling up to 20 hours a week. Nice work if you can get it, but take care to avoid overtraining and pushing yourself too hard. It’s very important to recover fully after each bout of cycling in order for your body to rebuild and come back stronger.
Q25 What is the longest ride you do in a normal week?
0-10 miles 2.6%
10-15 2.9%
15-20 4.7%
20-30 12.2%
30-40 15.8%
40-50 18.7%
50-60 16.8%
60-70 12.5%
70-80 7.5%
80-90 2.4%
90-100 1.5%
100+ miles 2.4%
Between 40 and 50 miles is the most popular distance for the weekly long ride, which works out at 2,400 miles a year. A lot of you ride closer to 80 miles on your longest ride, which suggests an interest in local races or sportives.
Q26 Which cycling or fitness apps do you use?
None 15.5%
Strava 68.1%
Map my Ride 12.2%
Edomondo 3.9%
Training Peaks 5.0%
MyFitnessPal 6.8%
Garmin.Connect 41.1%
Wahoo Fitness 1.6%
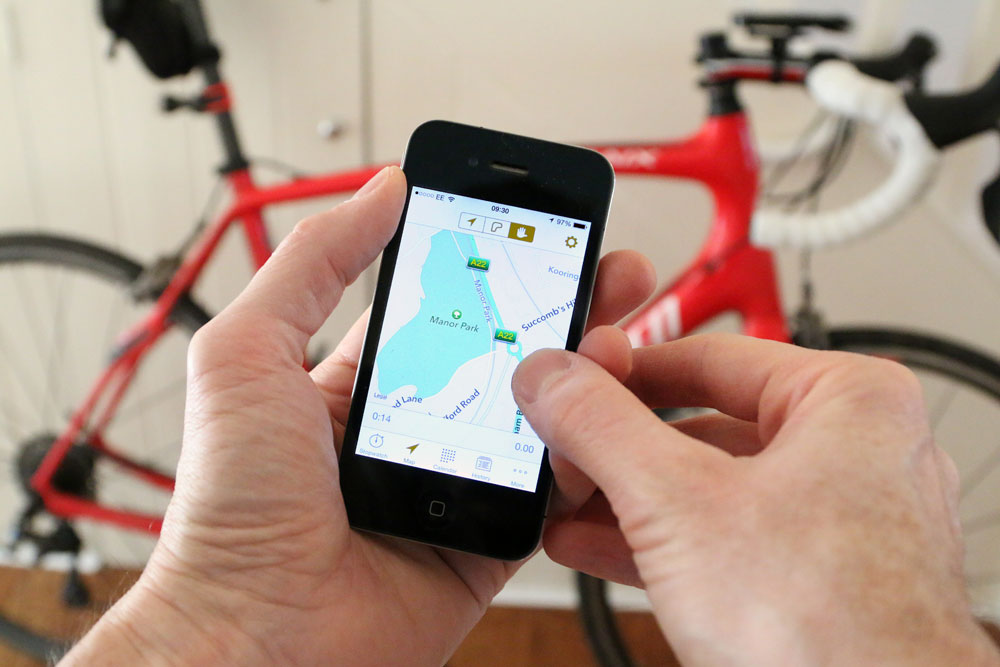
Strava (surprise, surprise) and Garmin Connect are the two most-used apps among CW readers. Strava, an online platform onto which you can upload your cycling activity data for analysis and comparison, has shot through the roof in popularity since its launch in 2009. In a world driven by competition, data and numbers, the thrill of taking the crown on a particular Strava segment or achieving a PB is addictive for some people, and has become an obsession. But be wary. Remember why we cycle in the first place — for fun! It can be very easy to forget that and become overly obsessed with online statistics and virtual chest-thumping.
Q27 Do you do any off-bike exercise?
None 21.4%
Strength and conditioning/core work 43.4%
Flexibility 19.3%
Pilates 4.6%
Yoga 5.5%
Swimming 17.9%
Running 28.8%
Rock climbing 4.0%
Walking 28.0%
Kayaking 2.5%
Finally, it seems our message is starting to get across to the masses. We on the Fitness team are forever advocating the benefits of working to strength and conditioning programmes. A strong core doesn’t mean weight gain; it means strengthening your body, in particular your core, to ensure your body is capable of withstanding the pressures placed upon it. A strong core will help provide a stable platform for your hips and legs to work from. Conditioned muscles will also reduce the risk of rocking from side to side and mitigate the chances of developing low back pain.
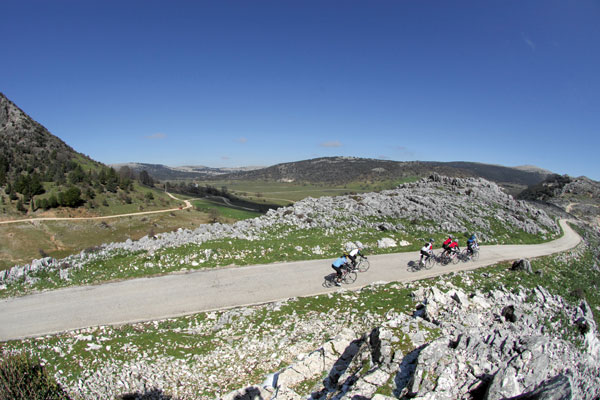
Q28 Have you been on a training camp?
Yes 10%
No 57%
No, but I may in future 33%
Q29 Which fitness goals are you working towards?
Road Race 18.2%
Time Trial 17.4%
Sportive 37.5%
Cyclo-cross 3.7%
Lose weight 37.5%
Get faster 50.9%
Enjoyment 50.8%
None 3.5%
Q30 Have you had a professional bike fit?
Yes 33.7%
No 33.7%
No, but I may in the future 32.6%
Results don’t get much more evenly split than this. They say a picture paints a thousand words; our results doesn’t have to elaborate much for us to conclude that most of you are pretty unsure just how beneficial a bike fit can be.
Who are you?
Do you think these results fairly represent UK cyclists? Maybe you a completely different kind of bike rider?
Email us at robert.hicks@freelance.timeinc.com or fill out the comments box below to let us know your thoughts.