Taking on the pros

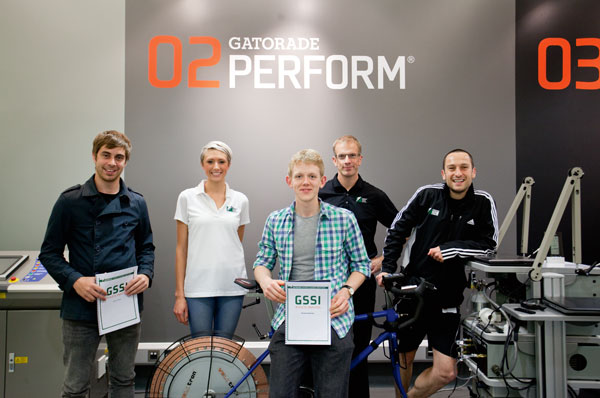
In April of this year, the GSSI Performance Laboratory opened on the campus of Loughborough University.
Their belief is to create a wider image of how people perform, how they can improve with the help of correct nutrition and get a wider perception, based on results, of what is needed to be the best.
Over the past six months, athletes such as Victoria Pendleton and Lucy Garner have passed through their doors, as well as top triathletes, footballers and rugby players.
They have also conducted sweat tests on many members of the GB track squad and Team Sky. And now, it was Cycling Weekly's turn to go through the testing system.
Guinea pigs
News writer Richard Abraham and I were the two lucky guinea pigs to go through the rigorous testing, where their results would then be compared to that of a typical elite level cyclist, known simply as Rider X.
With such a variety of tests to be conducted, ranging from VO2 max tests and anaerobic capacity right the way through to cognitive function, we thought we would send two staff members who could best incorporate the different tests and hopefully, give Rider X a run for their money.
The latest race content, interviews, features, reviews and expert buying guides, direct to your inbox!
Richard is a keen rower, and who until recently, was apart of Durham's University cycling club and gets in at least nine to ten hours riding a week. Robert on the other hand - although cycles regularly - comes initially from a background of football and cricket. We will compare each score and use the better one against Rider X.
Serious fun
While the testing does has an element of fun to it - we use the term ‘fun' loosely - it is serious, and one that the researchers can learn a lot from, and the subjects themselves.
Sport science is all about research and data. The more sport scientists know - how athletes train, their weaknesses, their strengths, how they react to certain nutrition - the bigger the picture and information they have, and from there they can inform athletes and coaches on how to improve and get better. This type of fine detail is something we have seen Team Sky invest heavily in over the past few years.
"You can get these tests done in a lot of the labs from across the UK," says Dr. Ian Rollo, a sports scientist from the GSSI lab and current Sport and Exercise Nutrition module organiser at Loughborough.
"But very few, if any, can offer everything you would want under one roof, like us. Plus the huge database we have on so many athletes from around the world of different ages, gender and ability. That really helps us learn about athletes, their physiological profiles and the requirements needed for a certain sport.
"We know that everybody is different and the future of sports nutrition and physiology really is to individualise the feedback and the products."
What can you gather from the tests from individuals?
"From the tests, we can identify strengths and weaknesses and depending on what they are, we can tailor the advice and feedback afterwards to what the athlete needs. Whatever the goal is, whether it's performance, diet et cetera, and the advice would be specific to them.
"Due to our research and our fact and figures, we now have a picture and outline of what is needed to reach each level. And we can go into depth with athletes and, providing we know their goal, we can train them specifically to reach what the level they want to get to. It takes hard work and dedication, but it can be done."
These tests sound elitist, but as Ian points out, they can be used by anyone of whatever level who want to better themselves.
"We test a number of athletes, ranging from the top right the way through to recreational athletes. It all depends on what you want to achieve. We're looking to build a diverse database and we find it as rewarding working with lower level athletes who are just looking for a PB.
Elite athletes have a very good team around them anyway, so in some ways, it's far more beneficial for an amateur athlete. The amateur athlete isn't going too far wrong, but it's little things that we can advise or suggest which will have a big impact on their training and performance."
Weight and body fat
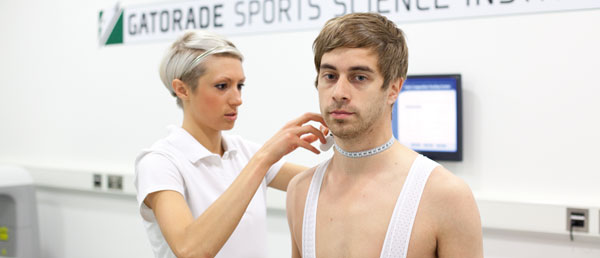
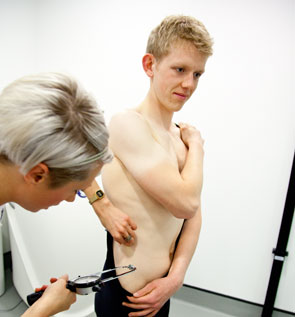
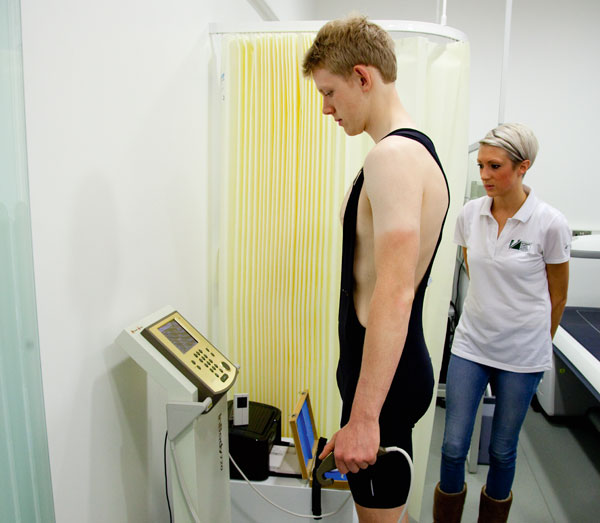
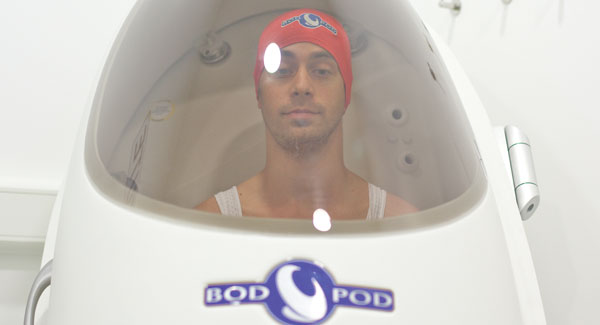
Body weight and fat is a key element in cycling. Pounds lost can equate to time gained on the bike. While it's important not to lose muscle, cyclists at the elite level are always keeping a close eye on their weight and body fat. There are many ways to record weight, but few are as thorough as the nude weighing, skin folds and Bod Pod that we went through. To the uninitiated, a Bod Pod is fundamentally the same as underwater (hydrostatic) weighing, but uses air instead of water and measures the volume of air a person's body displaces.
| Robert | 71.357kg (157.699lbs) | 14.8 |
| Richard | 73.603kg (162.663lbs) | 10.5 |
| Rider X | n/a | Row 2 - Cell 2 |
Measurements of the amounts of fat, muscle, water, and bone components in the body provide an evaluation of body composition. Rider X's body fat is less than 10 per cent and this has been known to drop even further, when preparing for Grand Tours. As you would imagine, Rider X has a far leaner frame than either of Robert and Richard. Rider X goes into an early lead.
VO2 max test (aerobic performance)
While we weren't expecting miracles with this one, we thought we would get a little closer to Rider X's score than we did.
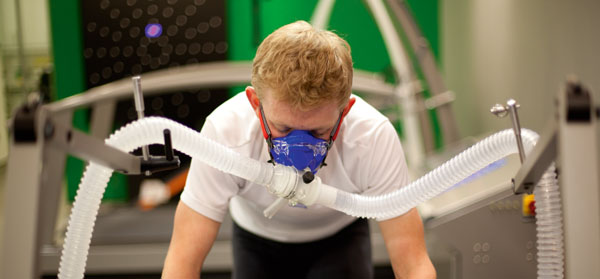
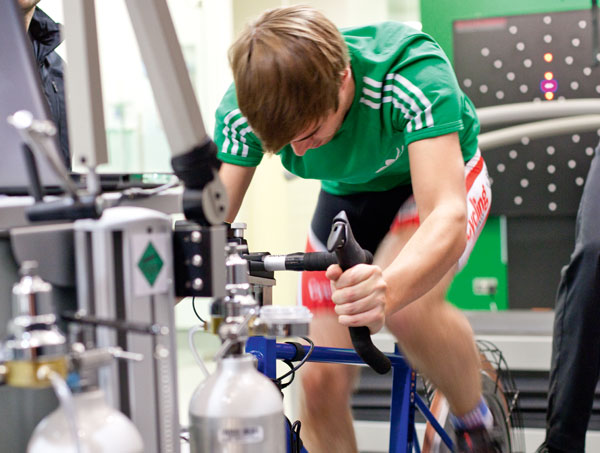
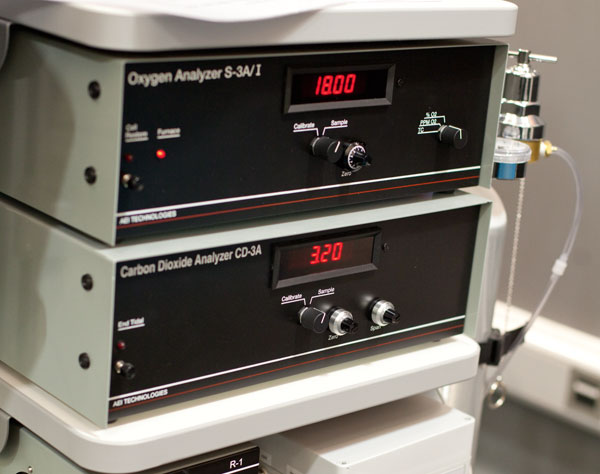
VO2 max tests aren't nice but are good indicators of fitness. Your VO2 max is the maximal amount of oxygen you can take up and use in one minute per kilogram of body weight. To put it simply, those with a higher V02 max are fitter and can work harder than those with a lower score. During this test, maximum heart rate is also recorded.
| Robert | 48.0ml/kg/min | 198bpm | 75% HRmax or 48% VO2max (0.29g per min) |
| Richard | 58ml/kg/min | 192bpm | 62% HRmax or 37% VO2max (0.35g per min) |
| Rider X | 70ml+/ kg/min | n/a | 0.8-1.0g per min |
While Robert and Richard's scores are higher than the average (untrained adult male will have a VO2max of around of 45ml/kg/min) they are significantly less than Rider X's score of 70ml+. It's hardly surprising, as the need to get oxygen and utilise it, is vital for aerobic performance but it does go to show the scale of the difference. American cyclist and three times Tour de France winner, Greg LeMond had a VO2 max of 92.5
There is a plus side; we can work on our VO2 max, and it will improve. However, many people believe it is aerobic training, which will see the biggest gains, which is wrong, as it will only improve it to a certain extent. High intensity training is the most effective way to increase it. For example, ten four minute bouts of cycling at 90% of VO2 max with two minute rest between intervals is just one exercise to try.
Our Fatmax was also tested, which shows the exercise intensity at which the maximal amount of fat is used for energy. For cyclists or endurance athletes, this is the energy system we want to use, as it allows us to hold on to our carbohydrate stores, which are vital for bursts of energy.
Robert burns fat between 39 and 58 per cent of his VO2 max, or a heart rate of 117 and 175 beats per min, which corresponds to cycling at 95w. It can be broken down even further: burned fat at 0.29g per min or 17.4g per hour.
Richard burns fat between 29 and 44 per cent of VO2 max, or a heart rate of 98 and 146 beats per min, which again, corresponds to 95w. Breaking it down further: burned fat rate of 0.35g per min or 21g per hour. Rider X however, burned fat rate of 0.8 to 1.0g per min highlighting the efficiency of their use of their fat energy stores and saving carbohydrates for larger efforts such as climbs and attacks. Thankfully, you can improve your maximal fat oxidation score - up to 40 per cent in some cases - by training at your Fatmax level.
Cognitive function & ISpan
This is where we thought we would make up some points. Cyclists aren't renowned for their hand eye coordination, and with two tests that require reactions and quick-footed movement, we were fairly confident - especially with a cricketer on board.
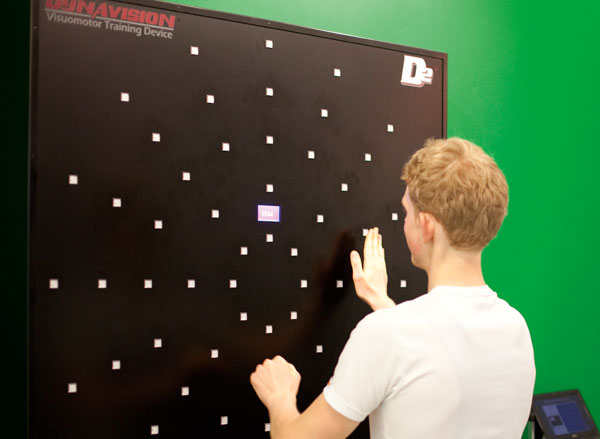
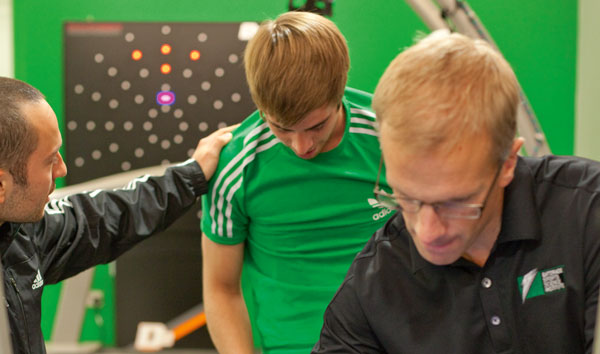
However, it's easy to say cyclists have poor coordination and reactions but it's not really the case. For example, sprinters require razor sharp reactions when in a bunch sprint, reacting to movements and gaps while avoiding making contact with other riders. Still, this was our moment. A machine called D2 was the first test, which required the person to touch buttons once they lit up while also reading out a four-digit number that changed every few seconds. The number was only displayed for a second. Results were recorded on accuracy and eye-hand reaction time.
| Robert | 46 | 0.72s |
| Richard | 86 | 0.63 |
| Rider X | 60-80 | n/a |
We don't want to gloat, but we won! First point on the board for CW, although it's worth noting that it was cyclist Richard who scored the point and ball player Robert was last, scoring nearly half as many hits.
Many people are unaware that like physical performance, cognitive function can too be improved. And for cyclists, it's very important and something that we should all work on.
A sharp, aware mind will make you a far better cyclist, being able to make important decisions, and react to others around you. Mark Cavendish plays speed chess to keep his reactions up to scratch. Nutrition and hydration really helps as well.
Research shows that those in a dehydrated state had slower reaction times and reduction in attention, while those who are sufficiently fuelled has been shown to improve awareness.
When Lucy Garner visited, Dr. James Carter, the head of the GSSI tweeted that she scored a D2 best of 111. For this test, we chose to ignore that.
ISpan
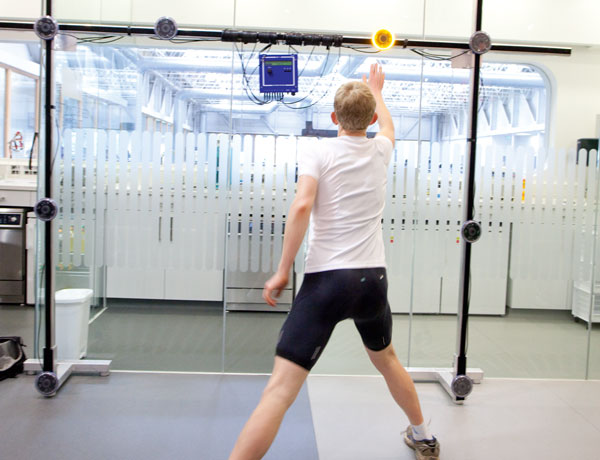
The next cognitive test was the ISpan, which assesses motor skills - specifically, how quickly you can process a target and are able to physically move your body to respond. Whereas the D2 test looked at mental reaction, this one looks at our physical reaction as well. This could be linked to our ability to jump on someone's wheel when sprinting or reacting to an attack on a climb - another test and skill that a cyclist may not prioritise but is very important.
| Robert | 19.48secs |
| Richard | 19.32secs |
| Rider X | 21-18 |
Rider X's score ranges from 21-18 seconds, so for the purpose of this test, we're going to split the time down the middle at 19.5secs, which means we scored another point. This is a surprisingly close result, but goes to show how well rounded an athlete cyclists actually are.
Peak power and anaerobic capacity
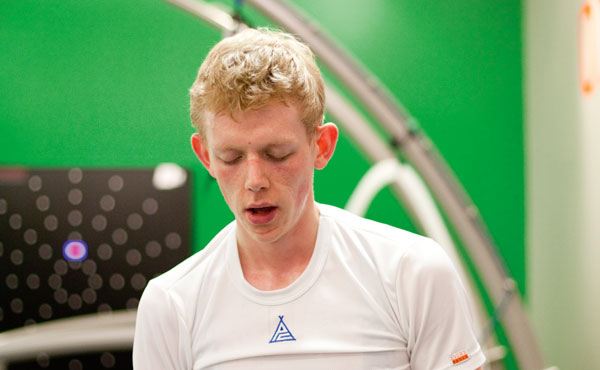
The final test and perhaps the most feared among cyclists. The Wingate test will measure two things, peak power and our mean power. While the test goes on for 30 seconds, the intensity of it is designed to push the body to its limits.
The assessment of peak power test is to provide information related to your ability to use ATP (Adenosine Triphosphate), CP (Creating Phosphate) and glycolysis to produce power, speed and your ability to maintain the high energy output.
Knowing an athlete's peak power and resistance to high intensity fatigue provides an indication of their ability to accelerate, such as an attack on a climb, or a sprint. Mean power shows the average amount of energy produced over 30 seconds. This can give a good indication of who is the strongest over a short distance.
| Robert | 949w | 673w |
| Richard | 892w | 724w |
| Rider X | 1000+ | >823 |
Richard and I were well and utterly trounced in the final round. While Robert's peak power is surprisingly high for a leisure rider, it is nowhere near Rider X. And this figure is even greater among some elite cyclists. Some top road sprinters push out over 1700 watts for the final kilometres and the likes of Chris Hoy can push out even more.
While we can improve our figures - through training plans working and maintaining at maximal/ near maximal intensity - very few of us have the right physical make up, time and dedication to achieve figures that some of these pros seem to have.
| Robert | 71.357kg (157.699lbs) | 14.8 |
| Richard | 73.603kg (162.663lbs) | 10.5 |
| Rider X | n/a | Row 2 - Cell 2 |
Measurements of the amounts of fat, muscle, water, and bone components in the body provide an evaluation of body composition. Rider X's body fat is less than 10 per cent and this has been known to drop even further, when preparing for Grand Tours. As you would imagine, Rider X has a far leaner frame than either of Robert and Richard. Rider X goes into an early lead.
VO2 max test (aerobic performance)
While we weren't expecting miracles with this one, we thought we would get a little closer to Rider X's score than we did.
VO2 max tests aren't nice but are good indicators of fitness. Your VO2 max is the maximal amount of oxygen you can take up and use in one minute per kilogram of body weight. To put it simply, those with a higher V02 max are fitter and can work harder than those with a lower score. During this test, maximum heart rate is also recorded.
| Robert | 48.0ml/kg/min | 198bpm | 75% HRmax or 48% VO2max (0.29g per min) |
| Richard | 58ml/kg/min | 192bpm | 62% HRmax or 37% VO2max (0.35g per min) |
| Rider X | 70ml+/ kg/min | n/a | 0.8-1.0g per min |
While Robert and Richard's scores are higher than the average (untrained adult male will have a VO2max of around of 45ml/kg/min) they are significantly less than Rider X's score of 70ml+. It's hardly surprising, as the need to get oxygen and utilise it, is vital for aerobic performance but it does go to show the scale of the difference. American cyclist and three times Tour de France winner, Greg LeMond had a VO2 max of 92.5
There is a plus side; we can work on our VO2 max, and it will improve. However, many people believe it is aerobic training, which will see the biggest gains, which is wrong, as it will only improve it to a certain extent.
High intensity training is the most effective way to increase it. For example, ten four minute bouts of cycling at 90% of VO2 max with two minute rest between intervals is just one exercise to try. Our Fatmax was also tested, which shows the exercise intensity at which the maximal amount of fat is used for energy. For cyclists or endurance athletes, this is the energy system we want to use, as it allows us to hold on to our carbohydrate stores, which are vital for bursts of energy.
Robert burns fat between 39 and 58 per cent of his VO2 max, or a heart rate of 117 and 175 beats per min, which corresponds to cycling at 95w. It can be broken down even further: burned fat at 0.29g per min or 17.4g per hour.
Richard burns fat between 29 and 44 per cent of VO2 max, or a heart rate of 98 and 146 beats per min, which again, corresponds to 95w. Breaking it down further: burned fat rate of 0.35g per min or 21g per hour. Rider X however, burned fat rate of 0.8 to 1.0g per min highlighting the efficiency of their use of their fat energy stores and saving carbohydrates for larger efforts such as climbs and attacks. Thankfully, you can improve your maximal fat oxidation score - up to 40 per cent in some cases - by training at your Fatmax level.
Cognitive function & ISpan
This is where we thought we would make up some points. Cyclists aren't renowned for their hand eye coordination, and with two tests that require reactions and quick-footed movement, we were fairly confident - especially with a cricketer on board.
However, it's easy to say cyclists have poor coordination and reactions but it's not really the case. For example, sprinters require razor sharp reactions when in a bunch sprint, reacting to movements and gaps while avoiding making contact with other riders. Still, this was our moment. A machine called D2 was the first test, which required the person to touch buttons once they lit up while also reading out a four-digit number that changed every few seconds. The number was only displayed for a second. Results were recorded on accuracy and eye-hand reaction time.
| Robert | 46 | 0.72s |
| Richard | 86 | 0.63 |
| Rider X | 60-80 | n/a |
We don't want to gloat, but we won! First point on the board for CW, although it's worth noting that it was cyclist Richard who scored the point and ball player Robert was last, scoring nearly half as many hits.
Many people are unaware that like physical performance, cognitive function can too be improved. And for cyclists, it's very important and something that we should all work on.
A sharp, aware mind will make you a far better cyclist, being able to make important decisions, and react to others around you. Mark Cavendish plays speed chess to keep his reactions up to scratch. Nutrition and hydration really helps as well.
Research shows that those in a dehydrated state had slower reaction times and reduction in attention, while those who are sufficiently fuelled has been shown to improve awareness.
When Lucy Garner visited, Dr. James Carter, the head of the GSSI tweeted that she scored a D2 best of 111. For this test, we chose to ignore that.
ISpan
The next cognitive test was the ISpan, which assesses motor skills - specifically, how quickly you can process a target and are able to physically move your body to respond. Whereas the D2 test looked at mental reaction, this one looks at our physical reaction as well. This could be linked to our ability to jump on someone's wheel when sprinting or reacting to an attack on a climb - another test and skill that a cyclist may not prioritise but is very important.
| Robert | 19.48secs |
| Richard | 19.32secs |
| Rider X | 21-18 |
Rider X's score ranges from 21-18 seconds, so for the purpose of this test, we're going to split the time down the middle at 19.5secs, which means we scored another point. This is a surprisingly close result, but goes to show how well rounded an athlete cyclists actually are.
Peak power and anaerobic capacity
The final test and perhaps the most feared among cyclists. The Wingate test will measure two things, peak power and our mean power. While the test goes on for 30 seconds, the intensity of it is designed to push the body to its limits.
The assessment of peak power test is to provide information related to your ability to use ATP (Adenosine Triphosphate), CP (Creating Phosphate) and glycolysis to produce power, speed and your ability to maintain the high energy output.
Knowing an athlete's peak power and resistance to high intensity fatigue provides an indication of their ability to accelerate, such as an attack on a climb, or a sprint. Mean power shows the average amount of energy produced over 30 seconds. This can give a good indication of who is the strongest over a short distance.
| Robert | 949w | 673w |
| Richard | 892w | 724w |
| Rider X | 1000+ | >823 |
Richard and I were well and utterly trounced in the final round. While Robert's peak power is surprisingly high for a leisure rider, it is nowhere near Rider X. And this figure is even greater among some elite cyclists. Some top road sprinters push out over 1700 watts for the final kilometres and the likes of Chris Hoy can push out even more.
While we can improve our figures - through training plans working and maintaining at maximal/ near maximal intensity - very few of us have the right physical make up, time and dedication to achieve figures that some of these pros seem to have.
Rider X 3/4 CW 2
A good effort
It may have been wishful thinking to flirt with the thought that we could compete with Rider X. But we've given it a good go, and while it does show the immense difference between the top and the bottom it does give a valuable insight into just how well conditioned professional cyclists are in all aspects of physical and mental performance.
Remember, these tests aren't just to help the researchers, but you too. If you want to take your cycling seriously, then partake in a performance test. Get a good coach who can extrapolate the information and work on specific training plans to improve each area. It may seem like a lot of effort, but who do you know who got to the top without putting the hard work it in?
"Depending on what sport you look at, the data won't entirely tell us who is the better athlete. Team games have a number of factors for example, that could affect this. Endurance sports on the other hand will give us a much greater predicator of performance." Dr. Ian Rollo.
This article was first published in the November 8 issue of Cycling Weekly. You can also read our magazines on Zinio and download from the Apple store.