The road to ruin

Let's start by pointing out a fact that some motorists don't always understand: vehicle excise duty - ‘road tax' - goes straight into central government coffers and isn't set aside to pay directly for our roads.
Nonetheless, VED does raise a lot of revenue for the government. And although cyclists ride bikes, most of us also drive cars and hence pay VED too. So when it comes to the state of British roads and wondering where all that money goes, cyclists have just as much right - and often more natural aptitude - to moan as anyone.
Because most road maintenance money is filtered through regional authorities it is incredibly difficult to come up with complete figures. However, piecing different reports together can give us some clue.
According to the Asphalt Industry Alliance's (AIA) brand new 2011 Annual Local Authority Road Maintenance (ALARM) report, the total amount allocated to road maintenance in England and Wales was £2.9 billion. This doesn't include the money spent in Scotland and Northern Ireland, or funds used for building new roads.
Taking those extra figures into account as well, the total spend on British roads would come to around £7-8 billion - certainly more than the annual national income from VED, which in 2008/2009 was £5.441 billion. So far, so good in terms of the deal for road users.
However, the story doesn't end there. What about the extra tax income generated by fuel duty? (OK, with our cycling cap on we can't really claim a piece of this pie, but let's be indignant on the motorists' behalf.) That alone generates a whopping £24.615 billion - the overwhelming majority of which will never be used to pay for a pothole repair or a spot of sympathetic resurfacing. Then there's the money that comes from VAT on cars and bikes, accessories, etc.

No quarter
The latest race content, interviews, features, reviews and expert buying guides, direct to your inbox!
In all, it is estimated that the total benefit to the exchequer from road transport is in excess of £40 billion. But less than a quarter of this is put back into road infrastructure.
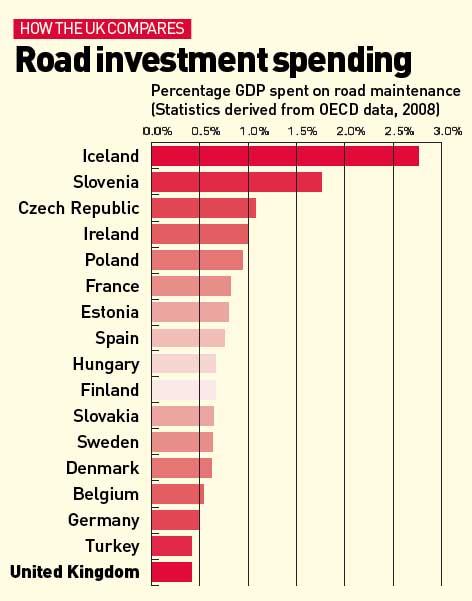
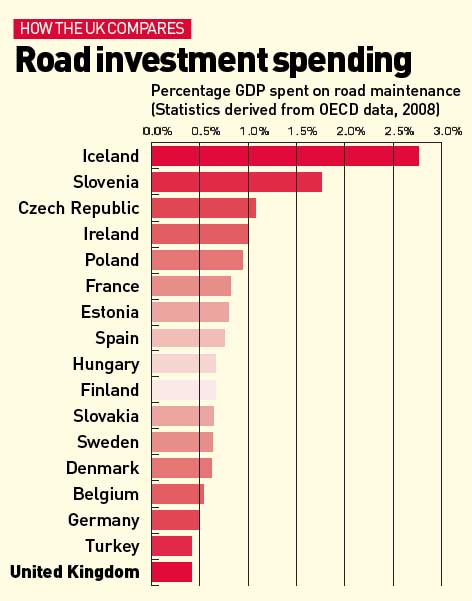
Of course that might be just how any typical country balances its books. To find out we decided to look at how road expenditure in the UK compared to that of other nations. Using figures from the Organisation for Economic Cooperation and Development (OECD) we discovered that in comparative terms the UK spends a smaller proportion of its gross domestic product on its roads than every equivalent European country (see chart opposite).
Not only is this incredibly frustrating, especially when your ride is ruined by endless potholes, but underinvestment in roads also makes poor economic sense.
A figure of £4.1 billion has been mentioned in terms of the total annual damage done to the national economy through poor road maintenance. And another recent report commissioned by the AIA - ‘The Economic Impact of Local Road Condition' - has stated the annual cost of poor roads to an average UK business is £13,600.
As part of that same AIA report the researchers also asked respondents about cycling. Over half those questioned (54 per cent) said they thought the general quality of roads wasn't safe enough for cyclists to use, quite apart from the threat of other vehicles or road dangers.
And almost one quarter of people who said they rarely cycle also stated that they would ride more if roads were better maintained. Extrapolated, this would equate to a further 19 per cent of the population riding their bikes.
That last statistic provides one simple message: if the roads were better maintained, more people would cycle.
What do you think of our roads? Email cycling@ipcmedia.com
This article originally appeared in the May 5 2011 issue of Cycling Weekly magazine